Business Models & Valuation
Valuation considerations for 4 business models. A study of 111 companies.
One tendency I’ve often noted is for investors to compare valuations of companies with completely different business models.
This is a dangerous habit that can lead casual observers to dismiss good companies that seem expensive.
Today I look at the relationships that exist between the 4 types of business models and the valuation of companies in these respective categories. This could help offer a lot of different insights.
Let’s jump into it.
Methodology & Assumptions
For this exercise, I picked 111 listed technology companies on the ASX.
Criteria were:
Technology focused companies: Those that have been readers for a while will know that my interest is in technology, so choosing tech companies was purely an interest thing.
Enterprise Value (EV): Company’s EV had to be below $1B, and preferably below $300M.
I ended up slightly bending this rule and including:
I included 7 companies with larger market capitalisation. I did this to broaden the scope of available measurements.
More than 75% of the companies chosen have a market cap below $300M.
This year estimates: Same as in the last few studies, for this year’s revenue, I made estimates on where these companies may land for full year revenue.
If guidance was provided, I simply used the mid-point of the guidance.
If no guidance provided, I didn’t do anything fancy, I simply annualised current run-rate.
Given we’re 3/4 of the way there, there’s no way it will exact, but it can’t be too far off either. Take the actual number with a big grain of salt.
Limitations: It’s obvious that looking at small pools of companies comes with clear limitations. In the asset creator category, I only included 13 companies. That’s because I wanted these asset creators to have a technology focus, and I simply don’t think there are many of these listed on the ASX in general. Hardware is hard as the VCs say.
Business Model’s relationship to Multiples
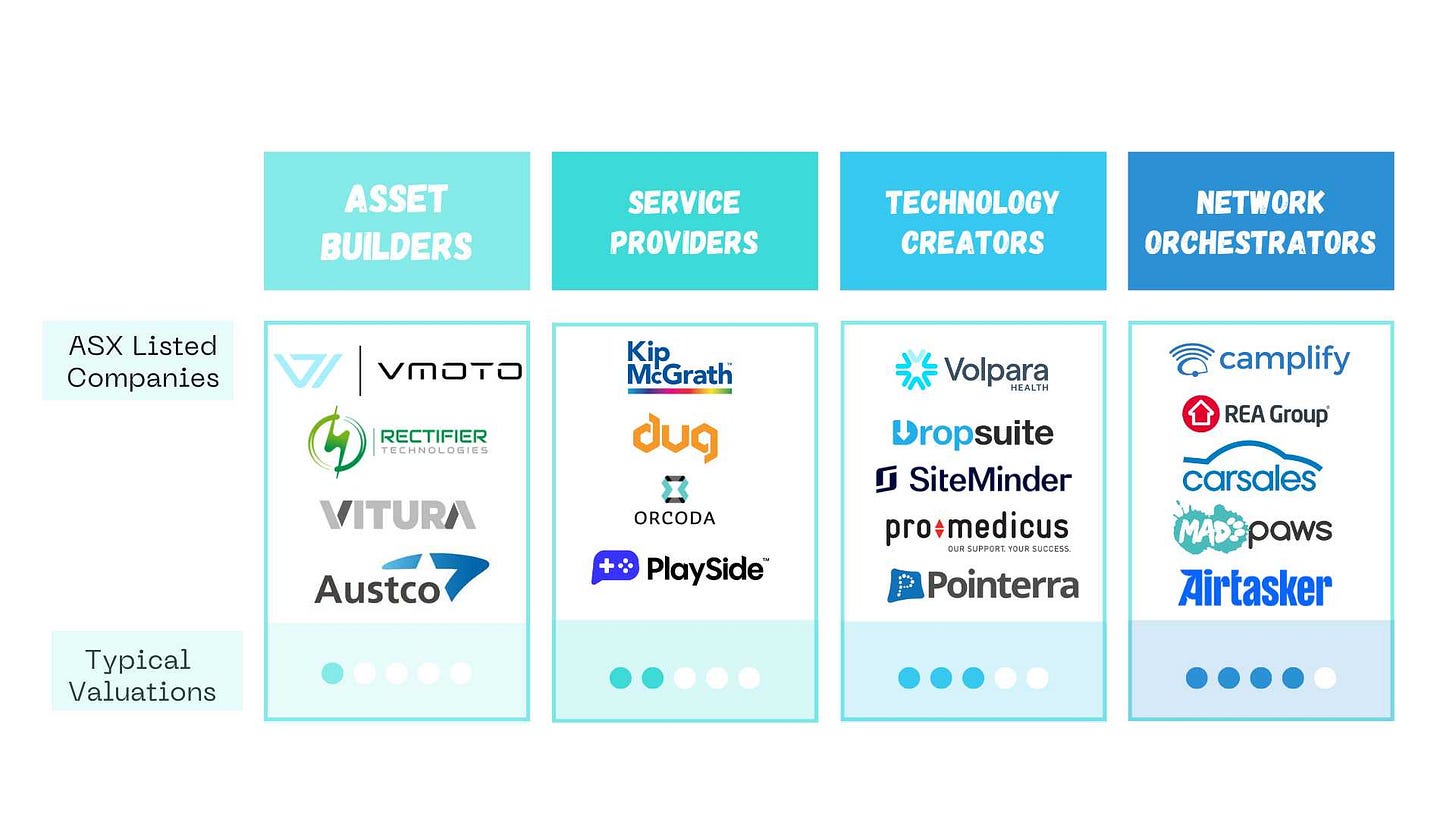
In The High Multiples Crew 🦅, I highlight my opinion that there are only 4 business models. You can see them in this graph:
At that time, I had put my thoughts on valuation per business model at bottom of the table with points. I did this with nothing but anecdotal observations from my experience. Now is the time to classify a proper list of companies, and dive properly into it.
How to classify by Business Models
Many businesses tend to combine multiple business model types.
An example of this is DUG Technology Ltd (DUG.ASX):
To make their business possible in the first place, they need to build these large high-performance computing (HPC) facilities (Asset creator)
They provide services to universities by lecturing on the applications of high-performance computing (Service Provider)
They also allow companies to rent out their HPC power for projects (Service Provider)
They have subscriptions plans were companies can pay to regularly use HPC (Technology Creator).
So classifying 1 business into only 1 category is not simple.
My methodology is simply to ask; where does most of the revenue come from?
Source: company's most recent 4C.
In the case of DUG, we can see it’s from services. I therefore classified them as such.
#1 - Asset Creators
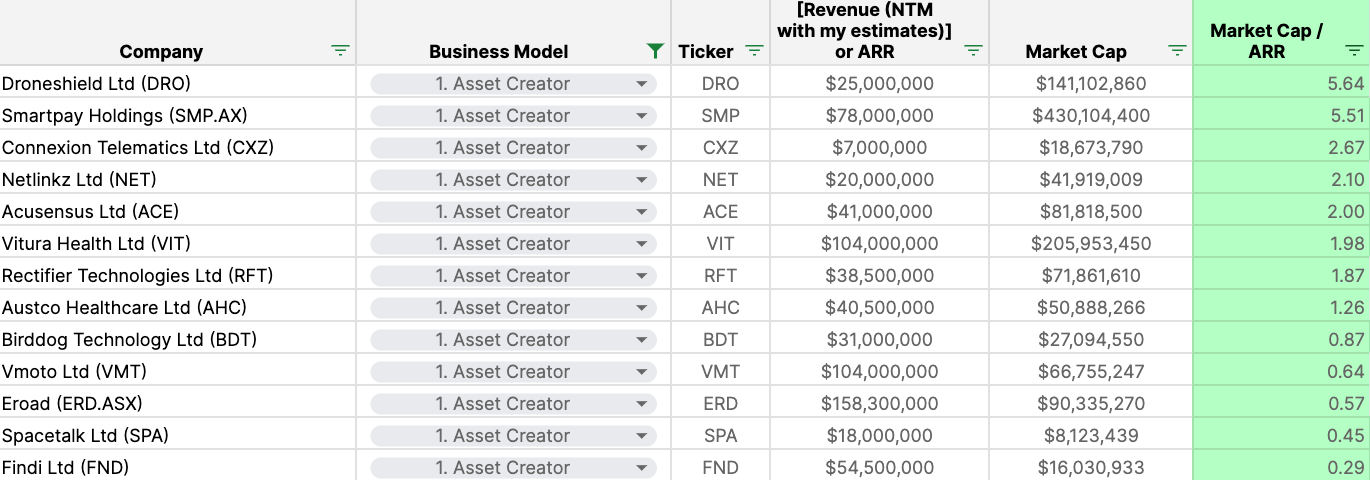
In the list I created, there were 13 asset creators.
Average valuation multiple: 1.98
We notice in this category 2 outliers with a valuation nearly 3x higher than the average:
Droneshield Ltd (DRO.ASX)
Smartpay Holdings Ltd (SMP.ASX)
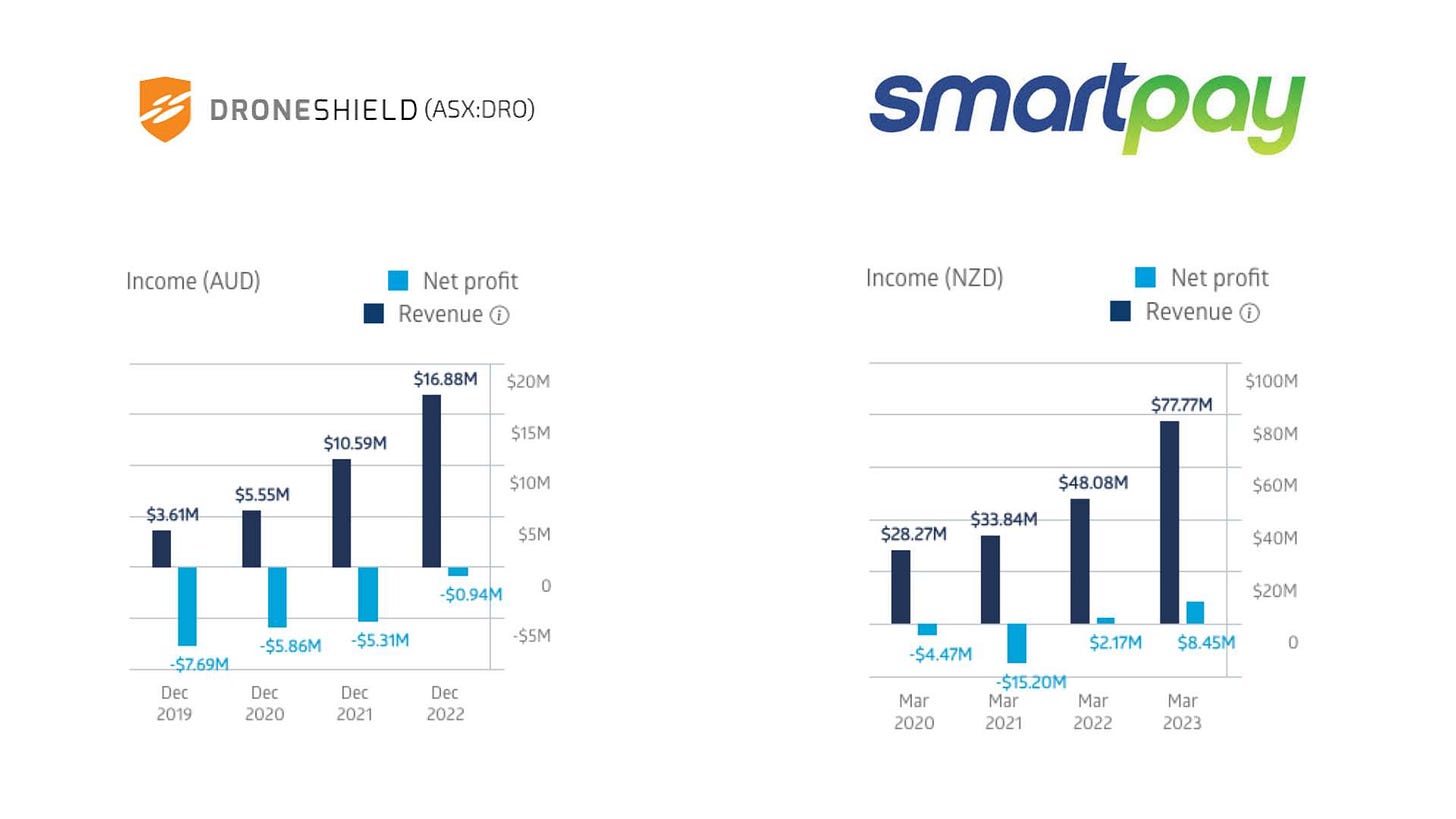
Why? If I had to put it down to one word, I would say: growth.
In short, for asset creators to command a high valuation, we need to see:
Strong execution leading to growth consistency
Proof of margin improvement
Let’s explore some of the key consideration for asset creators:
Large investment necessary upfront: Because asset creators are making a physical good, there tends to be a large investment necessary upfront.
This will typically remain true even in the case of the producer using contract manufacturing, because the manufacturer will demand a high upfront minimum order.
Are high margins possible? The worry with these companies is that operational leverage isn’t really possible.
Many companies have now proven this isn’t true (just look at Apple’s margins), but it remains much more challenging to see strong margins expand consistently overtime for these.
#2 - Tech-Enabled Service Providers
In this list, there are 13 tech-enabled service providers.
Average valuation multiple: 1.22
The average valuation of this small pool of companies that are primarily services based seems to show that the market has got little interest in such a business model at the moment. More than half of these businesses are trading at, or below this year’s revenue.
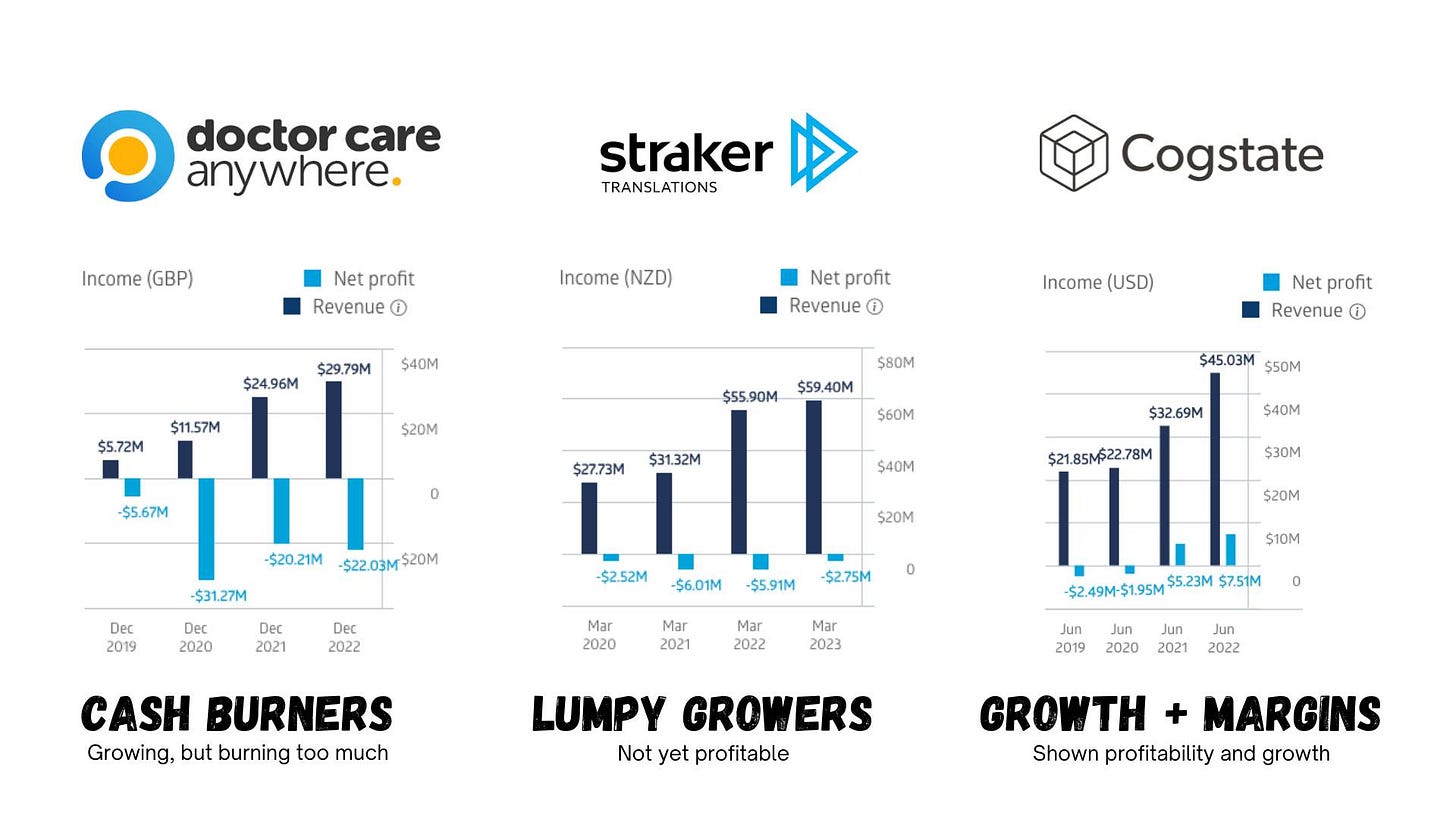
Why is this? Well, we can classify them in 3 categories which will explain the different valuations:
We can see from the above that cash burners in this category suffer, whereas those showing improving margins are proving out the business model’s potential upside.
Let’s explore some of the key consideration for tech-enabled service providers:
Your people are your assets: Whilst one could argue this is less true when services are largely technology based, traditionally the worry with this business model is in the people risk.
You need to hire for a very specialised skillset because your people are your products.
If you go through a dry spell of contracts, you must still pay your employees their high wages, and this puts pressure on your margins.
Next year’s revenue growth isn’t guaranteed. What we see with Straker is interesting; the company is growing, but the more lumpy nature of the growth tends to turn off some investors.
This is one of the challenges with this business model; clients tends to book on project basis, and when the project ends, you’re going to have to spend the effort to win back the same client again.
Good companies prove this wrong by planning long engagements that last multiple years, but it remains a challenge for most.
#3 - Technology & Software creators
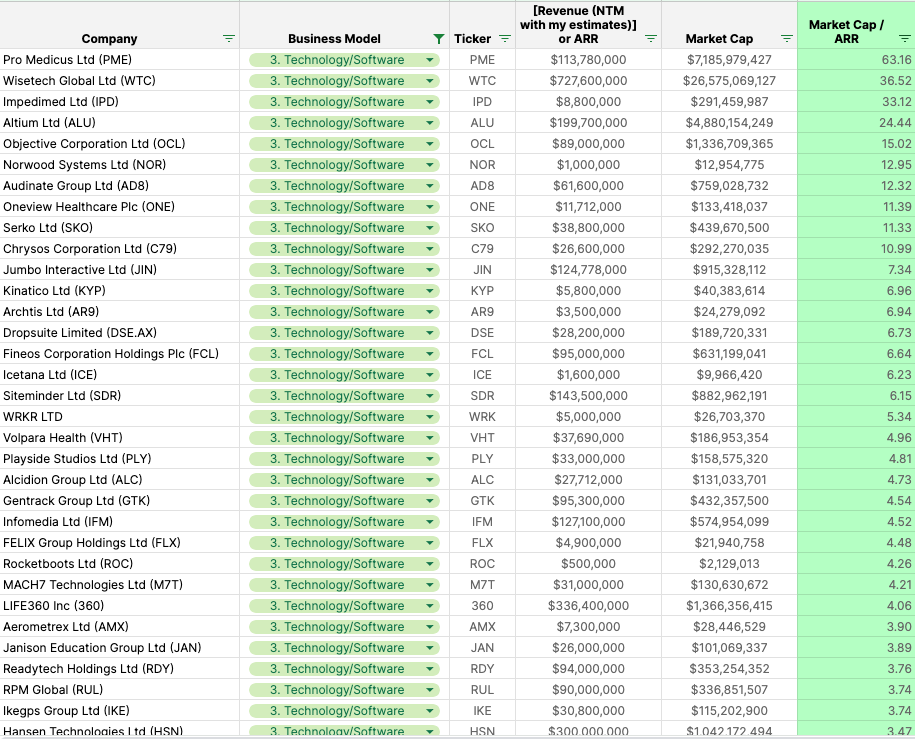
This is where the list was the biggest with 72 companies in this category.
The numbers are much higher here; whilst my interest is the primary reason for this, there are also many more companies choosing this business model at inception.
Average valuation multiple: 5.75
Why is the average so much higher?
Well, it appears winners can win big in this category. Here are the top 10 valuations:
Say we remove the top 5 because we agree that they are outliers (which might not be unreasonable), we now have:
Average valuation multiple (excluding top 5 outliers) : 3.63
Here are a few categories we find in this business model:
Let’s explore some of the key consideration for technology and software creators:
Recurring Revenue is powerful: Part of the reason why investors like software companies so much is because of a majority operating under a subscription model. This locks in customers and makes it hard to stop using the solution.
In turn, this gives companies a powerful source of recurring revenue. This means every new dollar won is typically a % of growth for your company.
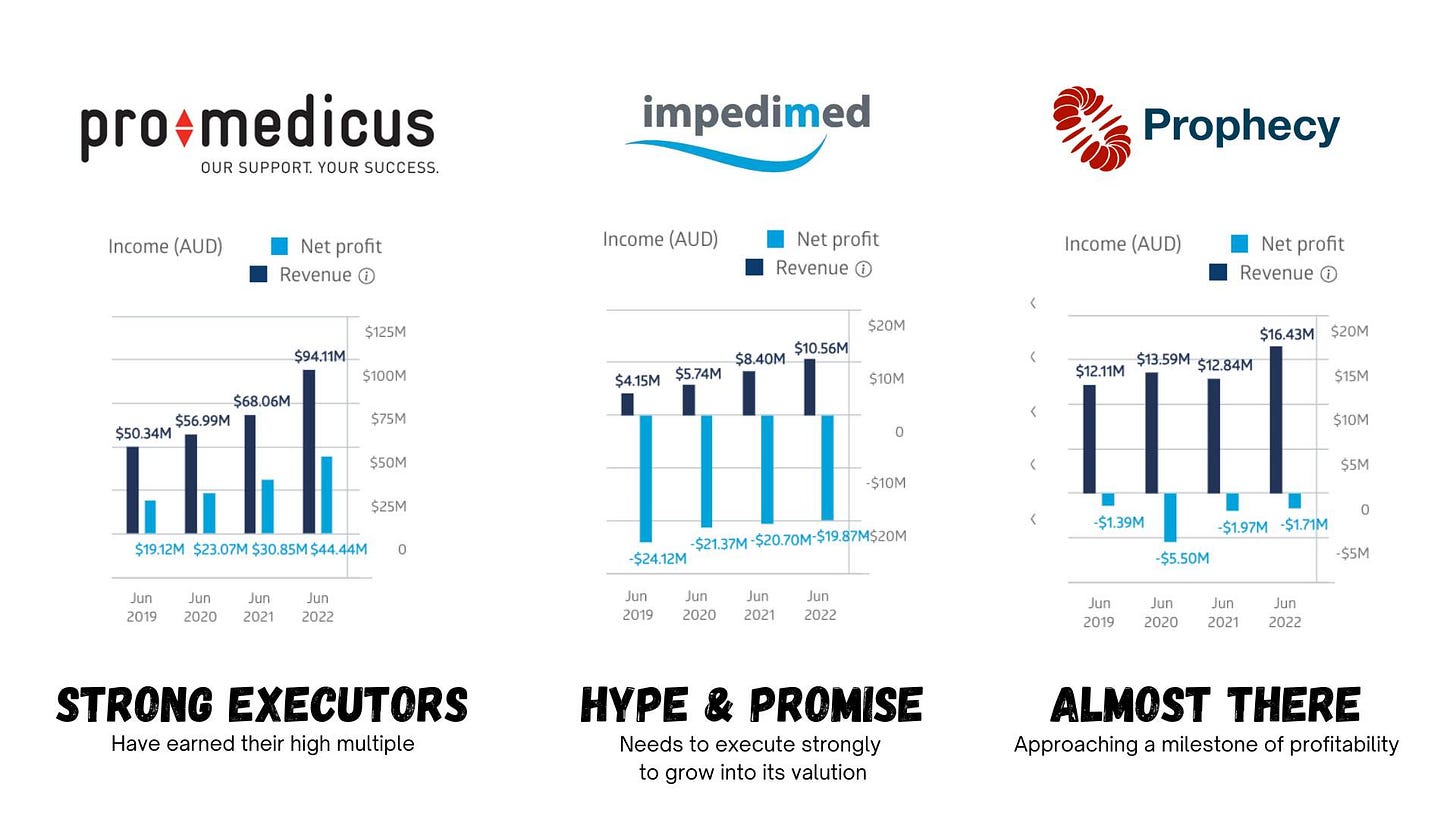
Recurring revenue creates predictable revenue. That’s why the charts for Pro Medicus, and Impedimed alike are consistent on the revenue growth side.
Prophecy, on the other hand, is a good example of a company transitioning its pricing model from one-off licensing to subscription. We can see the impacts of this in the years 20 to 21 and the drop in top line.
Margin potential is high. Looking at the winners in this category, we see very high margins. A software company at maturity can reach cash margins as high as 40% (some higher).
Of course, this is an example of outliers in the field, many won’t get close to this. But the structure of the model offers an advantage in this attribute that can be worth paying up for.
#4 - Network Orchestrators & Online marketplaces
There are only 9 companies in this category. Whilst it may appear there are limited number of categories for network orchestrators, I feel that we will see many more companies of this type coming to life in the next decade.
Average valuation multiple: 3.33
Let’s explore some of the key consideration for tech-enabled service providers:
How big is your opportunity? Amongst the most important consideration for network orchestrators is just how large the market is. Many of these business tend to keep part of “the size of the opportunity” in their valuation.
How green is the opportunity globally? If there’s another marketplace offering the same service in most other countries, then you will be limited to local growth. Australia isn’t necessarily gigantic for many asset classes (putting housing and transportation aside). Therefore, is marketplaces can’t show potential to expand outside of the country, their valuation will be limited.
Part of the reason why Rate My Agent retains a higher valuation, despite burning cash still, is because the opportunity they are currently pursuing in the US is large. If they execute on this (a big ‘if’ in my mind), then the payoff would be worth a lot.
Can you use your power to sell complimentary offerings? A marketplace offers a destination for a highly qualified potential buyer.
MadPaws are a good example of acquiring businesses that sell to their persona, and are now slowly proving this model might be able to pay out well. Let’s see if they can show profitability.
Margin potential is also high. Same as software, network orchestrators have a high margin potential.
Whilst Carsales is now much slower moving than it was on the growth angle, it retains its high valuation partly because of such high margins; in last report, EBITDA margins were nearly 50%, profit margins stood at 33%.
Conclusion and What’s Next?
In the continuation of this series, I will look at these 111 companies under a different angle, answering the question:
How does the industry they service, and their software type affect their multiple?
If you’d like that article sent to your email when it comes out, alongside the spreadsheet I used in this post, simply subscribe here.
As always, feel free to share your opinion and feedback.
Other Articles on Multiples
In The Low Multiples Crew (March 2023), I explore 15 tech companies trading on low multiples
In The High Multiple Crew (April 2023), I attempt to find commonalities between 9 companies that have earned a high valuation
In Today's Growth Multiples (May 2023), I contrast today’s valuations vs. historical 7-year average valuations of 25 companies
Disclaimer
The content and data on this website is for information purposes only, and should not be read as investment advice, or advice on tax or legal matters. The companies and strategies discussed are on the site for entertainment only, we may or may not at any time be invested in the companies, and may be referencing companies simply as examples, ideas or for discussion.
By viewing the contents of this article, you agree:
(1) you have read and understood the warning and disclaimer above;
(2) not to make any decision based on the contents of the article;
(3) not to place any reliance on the contents of the article; and
(4) that the author is not responsible or liable, directly or indirectly, in any way for any loss or damage of any kind incurred as a result of, or in connection with, your use of, or reliance on, any of the contents of these articles.


