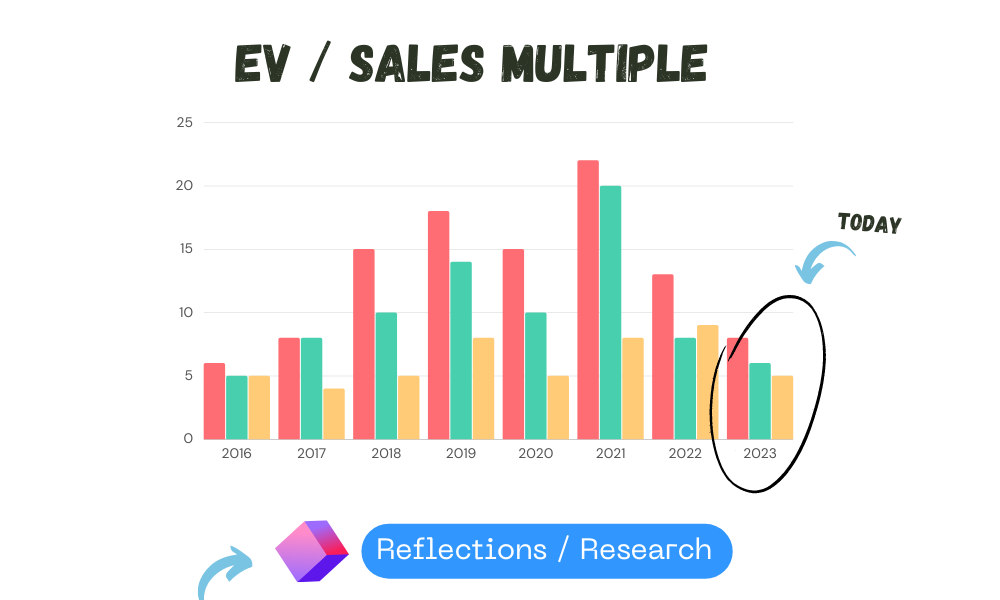
Today's Growth Multiples
Exploring today's valuations vs. historical
In his 1997 letter to shareholders (link here), Buffet writes:
Investors should rejoice when markets decline and allow both us and our investees to deploy funds more advantageously.
So smile when you read a headline that says "Investors lose as market falls."
Edit it in your mind to "Disinvestors lose as market falls -- but investors gain."
Easy to say, and hard to do amidst the confusion and difficult emotions that arise at the time. Adding to the difficulty is that in the moment, things are never as clear as they appear with hindsight.
Those that know me will know that I like to anchor myself in a good bit of data.
Today, we explore historical valuations and measure them against the current landscape in the world of small and mid cap technology companies.
Perhaps, that may be one tool in the toolbox to help us see more clearly If we should smile at dark headlines.
Methodology & Assumptions
For this exercise, I picked 25 listed technology companies on the ASX. Criteria were:
Time Horizon: Company had to be listed for at least 5 years to provide a viable minimum sample size for historic valuation.
I started with a goal to take into account 10 years of historical valuations, but it simply proved out too hard to find enough companies that had been listed for that long (in the universe of companies I care about).
I therefore changed the time horizon to 7 years, trying to align to a common conception that bull markets last on average 7 years.
Enterprise Value (EV): Company’s EV had to be below $500M, and preferably below $300M.
I ended up slightly bending this rule and including:
Infomedia (IFM.ASX), Pushpay (PPH.ASX) & Jumbo Interactive (JIN.ASX) in order to get to my desired number of 25.
Nearly all others have market caps below $300M.
I used Enterprise Value (EV) rather than market cap because it’s more accurate.
This year estimates: for this year’s revenue, I made estimates on where these companies may land for full year revenue.
If guidance was provided, I simply used the mid-point of the guidance.
If no guidance provided, I didn’t do anything fancy, I simply annualised current run-rate.
Given we’re 3/4 of the way there, there’s no way it will exact, but it can’t be too far off either. Take the actual number with a big grain of salt; the point wasn’t to spend much time on this; but more time on data crunching & pulling out lessons.
Step 1: Observe the last 7 years
Here’s what the (slight messy looking) full picture looks like:
A few observations:
Multiple expansion to 2021. The trend of multiples expanding can be seen for a majority of the companies from 2016 to 2021, when the market peaked.
Mach7 (M7t.ASX) sees their multiple expand from 1.69x in 2017 to 12.16x in 2021. That’s a 7 bagger in 4 years on multiple expansion alone.
Alcidion (ALC.ASX), from listing in 2016 to peak in 2021, saw its multiple go from 7x sales to 24x sales.
Jumbo Interactive (JIN.ASX) went from 0.91 to 12.65. That’s a nice 14x return on the multiple alone.
Small, cash-burning companies are hard to value. Of course, the trend I mention above is not true for all.
Xref, Medavisor, Prophecy and Gentrack saw their valuation mostly descend throughout this period of time.
Others, like K2Fly, Vista, and Envirosuite didn’t see much movement on their valuations.
Step 2: Look at the company’s individual average
Grouping valuations offers limited insights, because even within the same category (say B2B software), there are so many intricacies.
One company may have a 10x the total addressable market vs. another. Growth rates, how the software his built & how easy it is to implement, potential gross margins, etc, all these things have their impact.
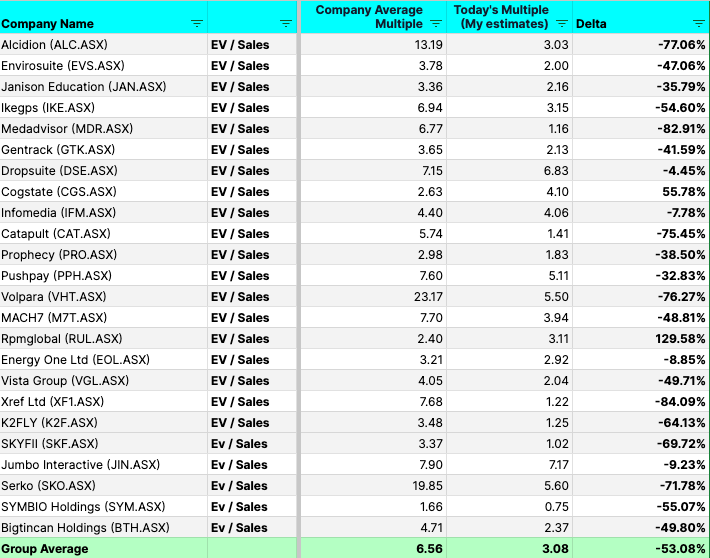
That’s why we want to look at a company’s individual average. This is what we’ve done here:
Step 3: Add today’s valuation & compare
Building on my point in the assumptions section, I made very rough estimates for this year’s revenues. I spent little time on this so don’t quote me on them (never advice anyway).
Given that many of these companies are on a 4C cycle, we have 3 quarters worth of data, so estimates are unlikely to be miles off.
Step 4: Stack Rank
Let’s filter by delta to average:
Summary: from this exercise, it now appears that small cap technology companies are trading at a 40% discount.
Can that be true?
Step 5: Factor for new playing field
Now, I know what you’re thinking, how have we gone this far without talking about the elephant in the room?
With these interest rates hikes driving the misery, we’ve learned once again that changes in interest rates can impact asset prices in a very meaningful way.
We must consider their influence on our new current reality. If you want to know how we do this, here’s the simple math equation:
Right, looks complicated, but it’s simpler than it seems.
Stick with me for this simple math example which assumes perfect rationality (this needs to be re-worded):
The value of a stock is the present value of future cash flows.
Interest rates drive the discount rate used to find the present value.
Below is a very rudimentary way of explaining this dynamic in order to show the large change in value due to changes in rates.
If a company has $10 in cash flow and the discount rate is 4% then it is valued at $250 ($10/0.04)
If a company still has $10 in cash flow but the discount rate increases to 8%, it is valued at $125 ($10/0.08).
Summary: The 3% rate increase from 4% to 8% drops the value of the asset by 50%.
According to this rudimentary exercise, what was a 40% discount, now becomes a 10% premium.
Is that right?
Step 6: Observe and Think
The above stated current premium can’t be completely true either. Interest rates were only at near 0% for about 1.5 years between 2020 and 2022. Prior to this period, they were hovering around 1.5 - 2%, which means we would have to revise the above calculation, and we would end up with a discount once more.
For humans in general, it’s typically the pace of change that causes action. In this case, this has been felt in the unseen before speed at which the rates have hiked have taken place.
Let’s remember that this is a very limited sample size, so we can’t draw any conclusions with high levels of certainty.
Nevertheless, the key themes that emerge are interesting. Here are some:
Small, fast growers are potentially at a discount
We observed current valuations sitting 40% below historical valuations.
Adding interest rates to the equation shows that this doesn’t necessarily mean they are 40% undervalued.
The powerful idea to keep in mind though is to remind ourselves that whilst we’ve seen 2 years of multiples decline, most have seen 2 years of revenue growth.
Let’s look at this:
So yes, it’s very possible that a discount exists.
Companies approaching turning points are getting dismissed
One thing that appears true to me is that in market declines, the typical investor response is to focus more and more on the short-term. Investors watch the day-to-day stock price movements and genuinely have their emotions bound to the direction of the market.
When you operate in the world of small fast growing companies, this attitude can set you back quite a bit.
That’s because many of these companies are still operating in the “invest for tomorrow’s growth” phase, and are not optimising for today’s free cashflow.
Applying the framework of “What’s the present value of their cash flow?” is simply too hard because when cash starts gushing in, it can surprise on the upside to many magnitudes.
Interest rates headwinds will eventually end
Without even doing anything fancy like turning to truflation.com for current data (but if you wanted too, I’ve capture it here), we’ve seen the RBA’s recent moves indicate we’re likely approaching the end of these hikes.
The simple exercise in Step 5 shows why it’s possible that a majority of these 25 companies had revenue growth this year and last, but their stock prices declined.
If interest rates hike stop, then the headwind against fast grower’s stock prices will subside too.
Let’s see what the next few years have in stock here.
I welcome you to draw your own observations and add to mine here. If you’re willing to share your thoughts, I would love to read them in the comments.
Conclusion
A smart man once said:
“You make most of your money in a bear market, you just don’t realise it at the time.”
-Shelby Cullom Davis
I’ll leave it there for today folks, I appreciate the time and attention, and hope this was valuable to you.
PS. If you want the Google sheet I built for this article, feel free to download it and make a copy 👉 here.
Other Articles on Multiples
In The Low Multiples Crew (March 2023), I explore 15 tech companies trading on low multiples
In The High Multiple Crew (April 2023), I attempt to find commonalities between companies that have earned a high valuation
Disclaimer
The content and data on this website is for information purposes only, and should not be read as investment advice, or advice on tax or legal matters. The companies and strategies discussed are on the site for entertainment only, we may or may not at any time be invested in the companies, and may be referencing companies simply as examples, ideas or for discussion.
By viewing the contents of this article, you agree:
(1) you have read and understood the warning and disclaimer above;
(2) not to make any decision based on the contents of the article;
(3) not to place any reliance on the contents of the article; and
(4) that the author is not responsible or liable, directly or indirectly, in any way for any loss or damage of any kind incurred as a result of, or in connection with, your use of, or reliance on, any of the contents of these articles.


Nice one mate! Plenty of revenue growth in there. I think if you can find some winners here it’ll pay off in the long term given how sold off small/micro caps have been.
Non advice obvs. Who are you liking the most from that list?